Design Goal
The goal of 2.131 Advanced Instrumentation and Measurement was to build a device that quantifies something that is normally assessed by human perception, such as sight or feel. The mechanical properties of human hair can serve as a valuable indicator of the hair’s overall health. Assessment of these properties is desirable to aid in the selection of hair care products. This device marks the first attempt to bring quantitative metrics used in hair product development into the hands of clients and hair salons. To meet these needs, a portable, iPhone™-based device to assess basic hair mechanical properties has been developed. This instrument measures the diameter, Young’s modulus and Poisson’s ratio of a hair during a static uniaxial tension test. A server is used to communicate between the user, the phone, and the hardware components of the device.
Link to full paper here: Report_HairTeam_final
Device Design
A. Summary of Device
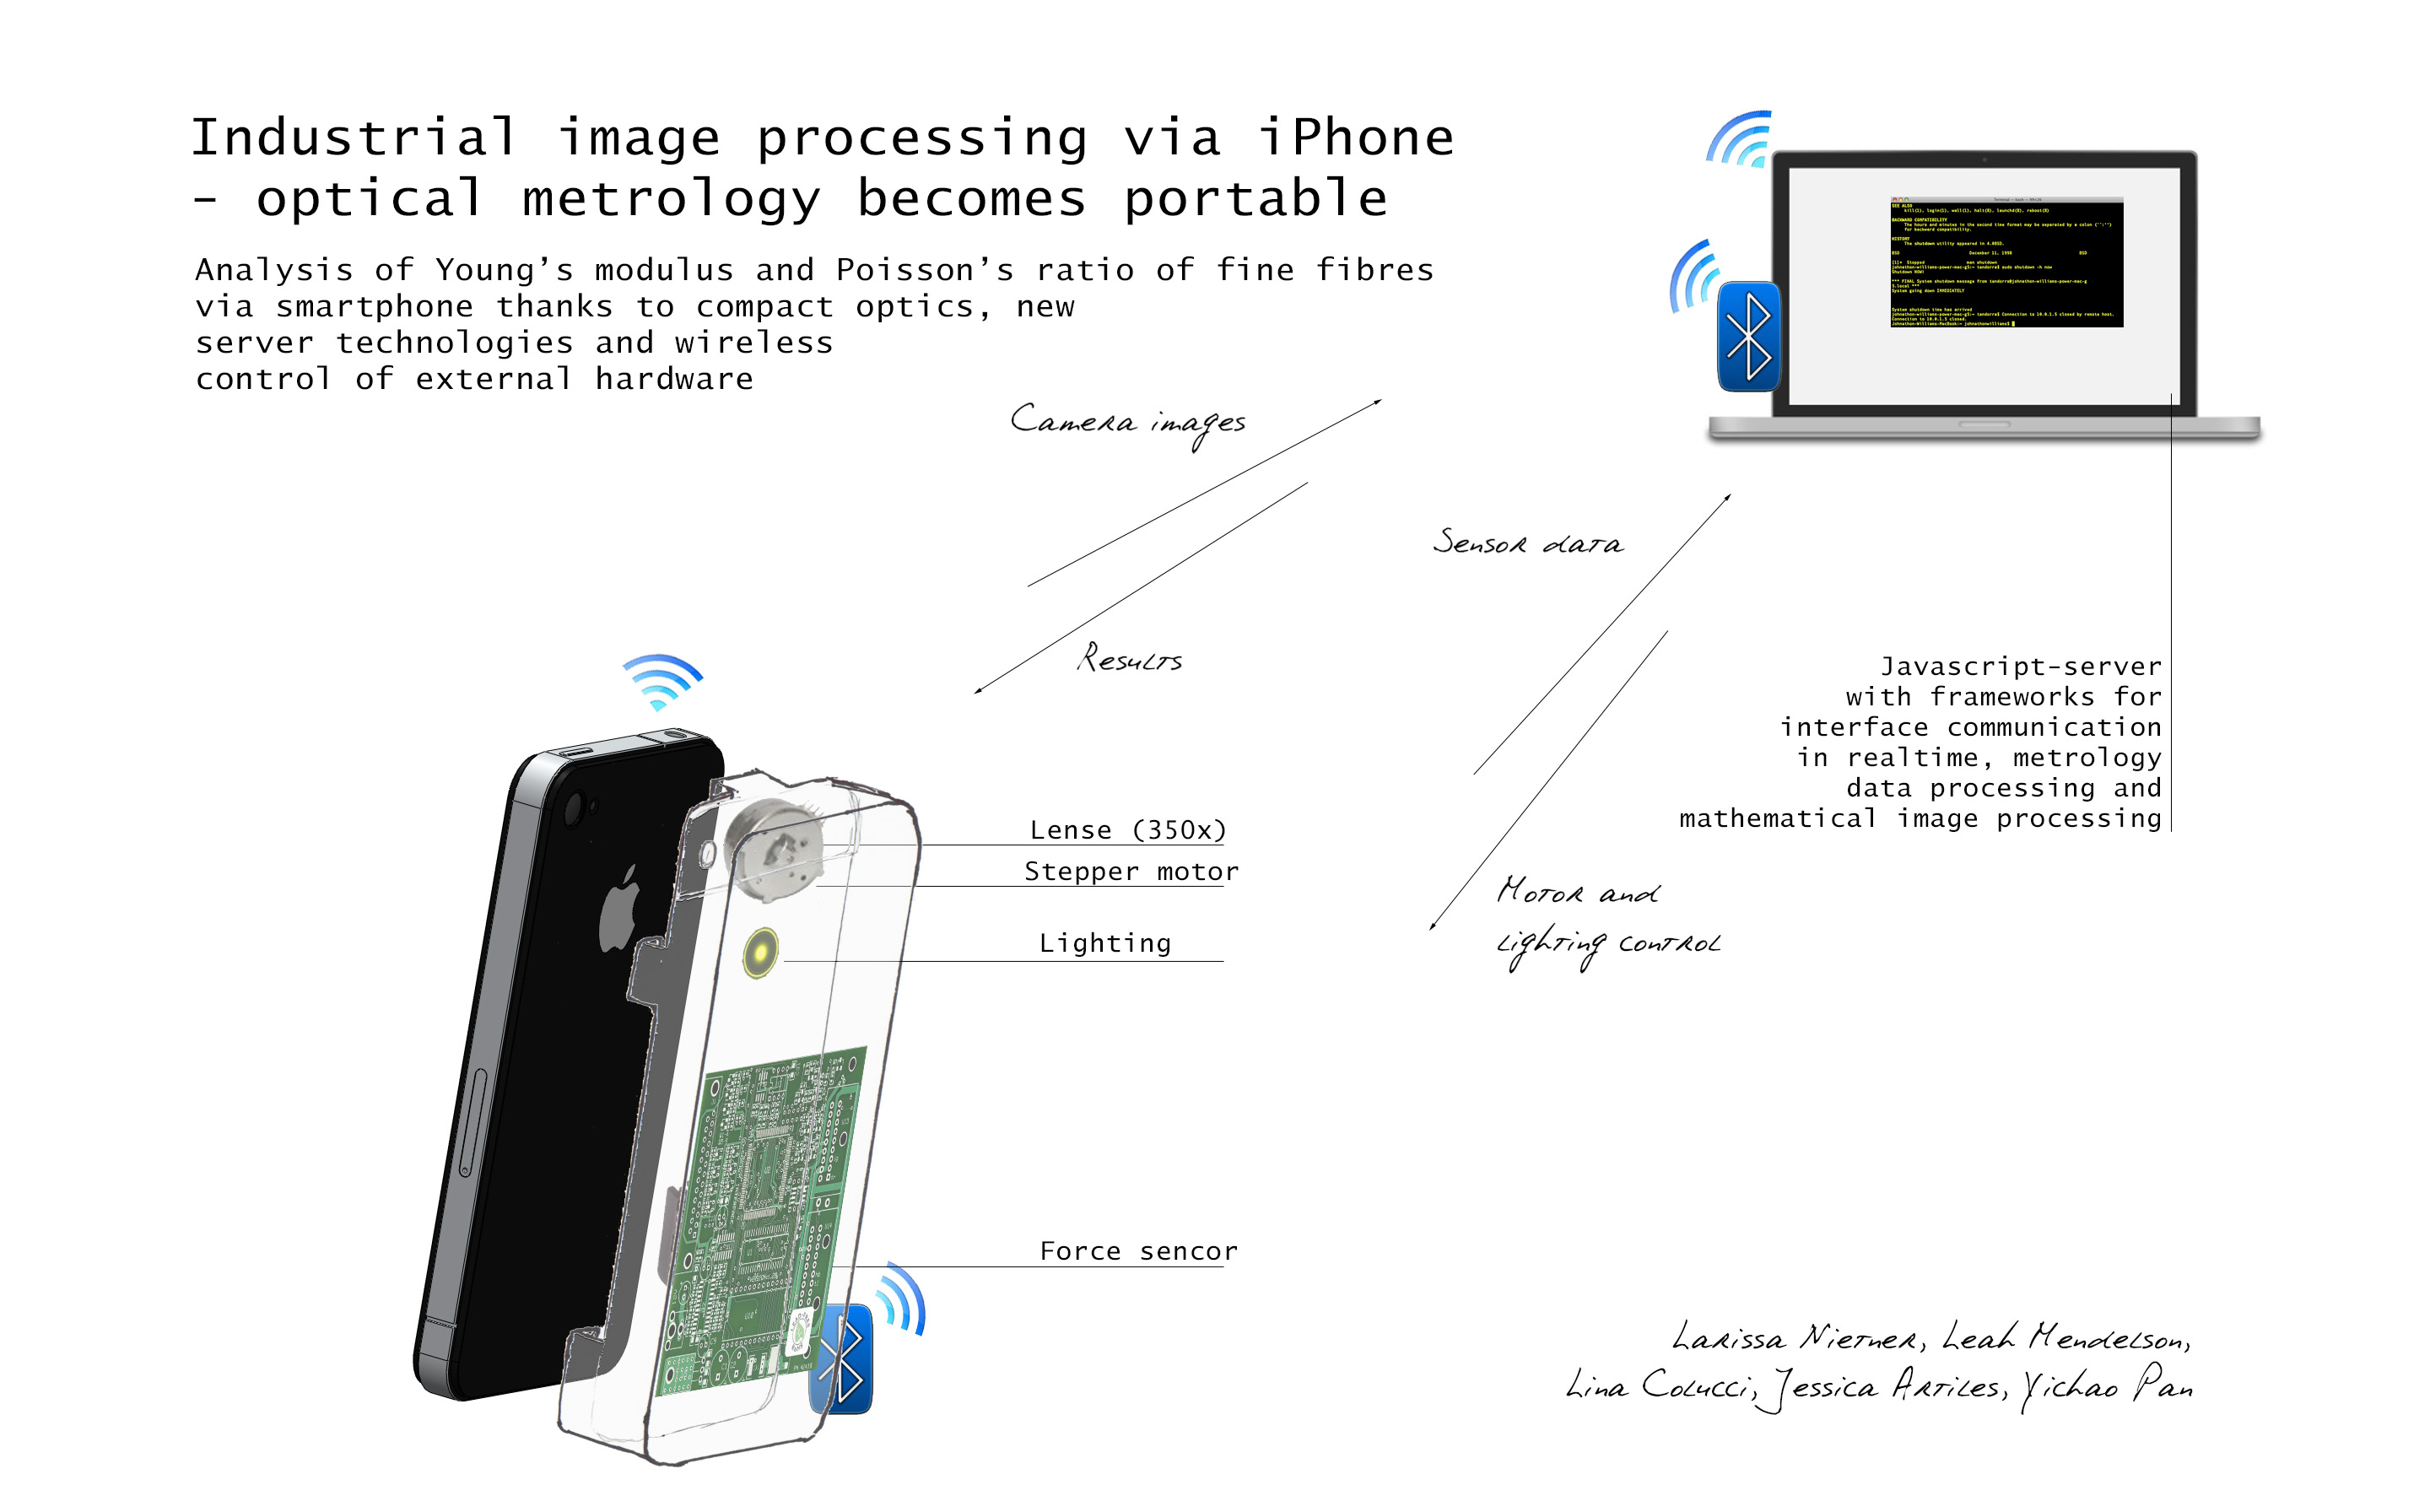
The device was constructed with various design parameters in mind: user-friendliness, compactness, easy of use, and integration with the iPhone™. The system needed to have reliable and reproducible movement of certain components as well as static elements that would withstand the rigors of residing in a portable device undergoing transport. The major components of the final device were the iPhone™, a stepper motor, a force sensor, a grip fixture for the hair, a microcontroller, a server, and a case. The components communicated as shown in Fig. 1.
To set standards for the portable device, tests were run on both a dynamic mechanical analyzer (Perkin Elmer 7e) and a fiber tester (T150 Universal Test Machine). The T150 has been used in previous studies of the hair’s Young’s modulus and elastic behavior as a function of hair color [8]. Data from both sets of tests can be found in Appendix A. The DMA data was unreliable due to errors attributed to inconsistent gage length. Data from the fiber tester was used to develop benchmarks for expected loads, strains, and displacements.
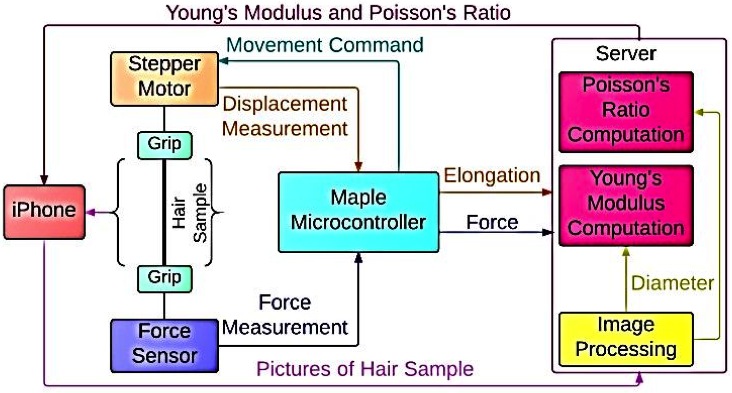
Fig. 1. Information flow diagram of the device.
B. Test Fixture
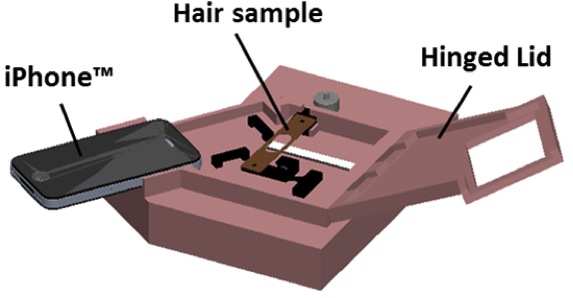
Tests are performed within a case that houses the hair sample, electronics, mechanical components, and iPhone (Fig. 2).
Fig. 2. CAD model of the hair testing device case with iPhone™
- Case
The case was 3D printed (Dimension uPrint) with ABS plastic. The case sits flat on a tabletop with electronics housed underneath. Since the iPhone’s™ camera must lie just above the hair sample, fine-tune height adjustment mechanisms were integrated into the case by drilling M2.5 set screws into U-shaped acrylic supports. Once the hair sample is loaded in place, the cover closes to prevent ambient light from disturbing our optical measurements. The layout of the case can be seen in Fig. 3.
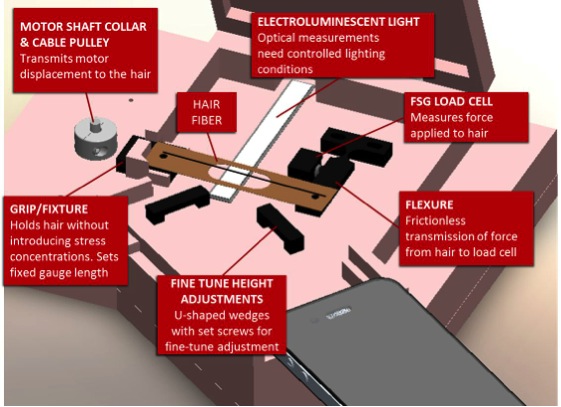
Fig. 3. CAD model of the interior components of the hair testing device.
2. Grips
The hair is attached to the device by gluing it in the middle of a thin cardboard holder (Fig. 4). This is an established method of fixing samples for a fiber test [8]. This attachment system prevents the introduction of a stress concentration in the hair (which causes the hair to break at the fixture point), allows application of a uniform stress on the fiber, and makes it easy to set a fixed gage length for the sample (2.5 mm for this device).
After gluing, the cardboard is screwed onto two mounts in the box: one on the flexure for the force sensor, and the other on the grip that attaches to the motor. Once the grip is in place, the sides of the cardboard are cut so that the hair may elongate during the test.

Fig. 4. Test grip used to hold the hair. The hair is glued to rigid fiberboard to prevent stress concentrations from forming from mechanical clamping on the hair itself.
3. Flexure
The force exerted on the hair was transmitted to a force sensor through a flexure laser cut out of 3 mm acrylic. The flexure system has many advantages over a coiled wire spring for translating loads including frictionless motion, one single component, and smooth and continuous displacements. An FEA Analysis (SolidWorks Simulation) was conducted to ensure that deformation was localized at the flexure, and that the cantilever, itself, remained rigid under load (Fig. 5).
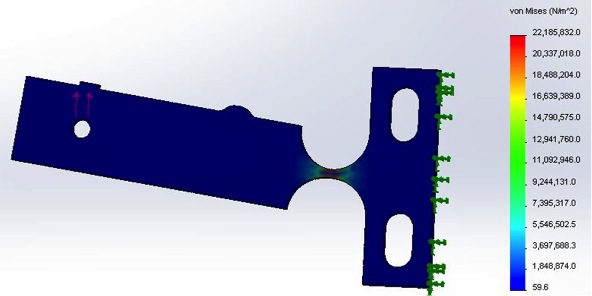
Fig. 5. Results of the FEA study revealed no stress concentrations in the flexure outside of the pivot point. Green arrows indicate the location of a rigid fixture constraint and red arrows indicate the location of 0.6 N applied in tension.
C. Electronics
The electronic hardware of the hair testing device consists of (1) microcontroller board (LeafLabs Maple [9]), (2) stepper motor (Nanotec ST6318F1004-A [10]), (3) stepper motor driver (Schmalz Haus EasyDriver [11]), (4) piezoelectric force sensor (Honeywell FSG [12]), and (5) instrumentation amplifier (Analog Devices AD623AN [13]). Fig. 6 shows the layout of the prototype electronics.
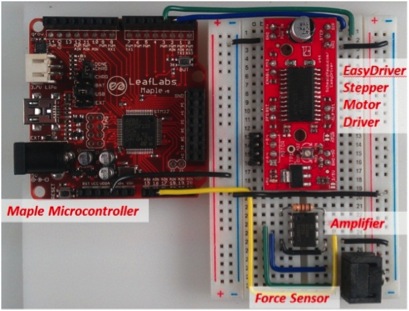
Fig. 6. Electronic component layout.
The Maple microcontroller board is the central component of all of the electronics, controlling the stepper motor, acquiring force measurements, and transmitting data to the server through serial communication.
Two digital pins on the Maple board are used to communicate with the EasyDriver, which controls the direction and steps of the stepper motor. The stepper motor rotates 1.8 degrees per step, and the EasyDriver can further divide each full step into eight microsteps. A shaft collar with an attached cable is mounted to the motor so that each step generates linear displacement. The cable attaches to a clamp holding one end of the hair fixture. If the hair fixture were coupled directly to the motor, it would change the stress distribution in the hair and the test would deviate from pure uniaxial tension loading. Hair normally will not yield at 4% strain, so the motor runs until 4% strain is reached. The motor runs three microsteps each measurement step, which takes 42 measurement steps to reach this strain limit. The motor operations is reliable, and a hair sample is pulled 23.5 µm each time the motor steps.
One analog pin on Maple is used to sample the amplified output from the force sensor. The force sensor is a full Wheatstone bridge, and the differential output voltage changes linearly along with the force exerted on the sensor button up to 14.7 N. The resolution of the force sensor is 0.24 mV/g when the supply voltage is 10 V. In the final version of the device, the supply voltage is 6 V, which lowers the resolution. Since the analog pin on Maple can take up to 3.3 V, the gain of the amplifier needs to be limited in order not to output a signal higher than 3.3 V. The gain is controlled by one gain resistor. The maximum tension in hair is set up to be 0.6 N so that the hair will not be yielded during the test. The flexure acts as an amplifier as well with a gain of 2.
The force sensor was selected based on fiber tester data on for the maximum force applied. The force sensor is a Honeywell FSG piezoelectric. Using standard weights to calibrate the force sensor on the device, a 510 Ω resistor is used on the amplifier, which sets the gain to 197. The signal output from the amplifier does not exceed 3.3 V when the tension in hair is 0.6 N. The analog-to-digital converter (ADC) on the Maple board has a resolution of 12-bits, or .73 mV, which gives 4095 counts per 3.3 V. Calibration of the force sensor was performed directly between the output of the ADC in counts and standard weights hanging from the device. This calibration showed that the resolution of the measuring device is 7.878 counts/mN.
The force sensor and flexure set-up was calibrated by hanging a set of precision weights from where the hair would typically pull. The output from the force sensor was amplified using an AD623 instrumentation amplifier. A plot of counts from the amplifier versus applied force was created and a linear fit was applied to the calibration data with R2=.9986 (Fig. 7).

Fig. 7. Calibration of the force sensor. The linear fit equation relating counts and applied force is:
Once the microcontroller has connected to the server, it waits for a serial signal from the server to start running the test. Since there is a preload on the force sensor, the microcontroller first samples the analog pin 100 times to zero the initial point. The actual measurements exclude this preload so that they only represent the tension measurements in the hair. Then the motor starts to step. After each step, the microcontroller averages 100 force measurements in terms of number of counts and sends the number to the server through serial communication. It runs in a loop for 42 steps in total. After collecting all 42 data points, a linear line is fit to the force-strain data and the slope is computed in the unit of number of counts over number of steps. This number is sent via serial communication to the server where the Young’s modulus calculation will be performed.
D. Imaging
The optical measurement system is centered on an iPhone™ 4 camera that has been converted to a microscope through the use of a 1 mm diameter spherical ball lens [14]. The lens is embedded in a 1mm sheet of silicone rubber and mounted to the phone using electrical tape. Uniform lighting behind the sample is provided by a panel of electroluminescent (EL) tape driven by a high voltage inverter (Supertex HV816DB2 [15]). The inverter takes an input of 3.3 V from a pin on the microcontroller and outputs +/- 180 V AC. Previous research has shown the magnification of such a microscope to be 350x [16]. However, the usable field of view is small, with aberrations and defocus prominent throughout the image. A sample image obtained using this lens is shown in Fig. 8.
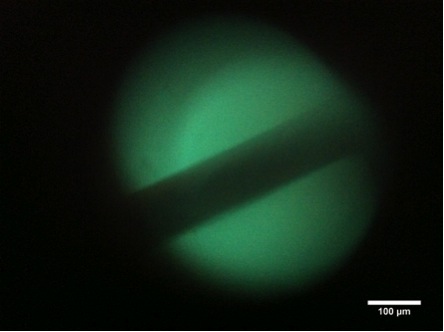
Fig. 8. Raw image of a 100 μm tungsten wire taken in the device.
As a result of the image quality, conventional image processing using methods such as edge detection and binary thresholding at a given grayscale value failed because of the defocus at the edge of the hair. For fibers, optical measurement can extract more information by characterizing the imaging function itself. Poisson’s ratios of fibers between 10-200 μm have been measured by intensity correlation of diffracted images [5]. A more robust method for edge detection, given the known geometry of the hair as a single darker vertical line centered in the image, is fitting sigmoid functions to each edge and using the zero of the sigmoid derivative as the edge location.
The images are preprocessed to extract a section of the hair from the center of the field of view and rotated (Fig. 9). The preprocessing routine is as follows:
1) Convert image to grayscale
2) Binary threshold to extract outside circle
3) Fit a circle to the binary image to determine image center and diameter
4) Crop to square inscribed inside field of view
5) Set a binary threshold for the inner image using Otsu’s method
6) Fit a line to each diagonal edge of the binary image using least-squares
7) Rotate image by angle determined from line fits so that the hair is vertical
8) Crop to a slice centered on the hair twice the hair width and 100 pixels tall (for 100 edge slices per side)
9) Contrast adjustment
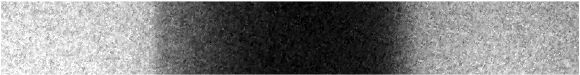
Fig. 9. Hair image after preprocessing. Each row of pixels across the pixels is fit to a sigmoid function on each edge to measure a diameter. The diameters are then averaged.
The intensity profile along the width of the image is fit to a four parameter sigmoid function:
y = yo + a/[1 + exp(-x – xo)/b]
Curve fitting is performed using the Levenberg-Marquardt algorithm for nonlinear least-squares fitting. Curve fitting was performed using the MATLAB optimization toolbox [17].
For faint, thin samples and samples with nonuniform lighting, the overall diameter is overestimated by an overall fit sampling all 100 rows at once. An alternate approach to the optical measurement is to fit a sigmoid to each row of the image. The probability density function of the diameter measurements across all 100 rows is Gaussian, with the mean taken to represent the true diameter.
The sensor is calibrated using the mean pixel diameter determined by the focus varying tests (since the focus will be locked in a slightly different manner for each test). The scale of the image is thus 3.11 pixels/μm.

Fig. 10. Grayscale intensity profile of the test image after preprocessing. Image is of a 100 μm Nitinol wire.

Fig. 11. Probability density function of the edge pixel location for one edge using the sigmoid fitting method.
Benchmarking tests were run on a sample of superelastic Nitinol wire with an initial diameter of 100 μm. Since the wire was pulled by hand, precise stress/strain measurements were not obtained. Using this measurement method, radial strain of 2% (10 μm) was resolved by the image processing routine. Tests were also run to characterize the effect of focus changes on the measured diameter. Two sets of 100 images each were taken of a 100 μm tungsten wire: one with the autofocus on the iPhone™ locked and one with the focus allowed to readjust after each image. Results showed that the imaging measurement is very sensitive to focus. With focus locked, the diameter range is 25 pixels or 8 μm (Fig. 12). Without this, the range is 21 μm (Fig. 13).

Fig. 12. Probability density function of the measured diameter of 100 images taken without focus change.
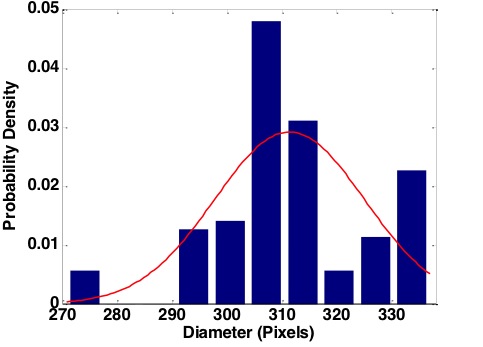
Fig. 13. Probability density function of the measured diameter with no brightness and focus lock applied. The diameter range standard deviation is much larger than with the focus locked.
E. System Communication
The device requires substantial communication between the iPhone™ and the other system components. In comparison to a computer, the iPhone™ has very limited data processing capabilities. Thus, image data from the iPhone™ must be transmitted to a platform that is capable of processing it. Also, the sensor and the actuator have to be controlled and synchronized with the phone. Due to limited serial interface access, the iPhone™, in the available iOS™ version, cannot directly connect to the sensor and actuator [18]. Hence, a server is used to connect the iPhone™ to these peripherals in addition to acting as a platform capable of image processing. The server also bridges between the iPhone™ and the microcontroller (Fig. 14).

Fig. 14. System communication diagram.
The server is written using node.js. Node.js is a serverside JavaScript framework that has been developed on the basis of Google Chrome’s JavaScript engine [19]. The server is run on a laptop (Apple MacBook Air™, 1.86 GHz Intel Core 2 Duo Processor, 2 GB 1067 MHz DDR3 RAM) and can be accessed by the iPhone™ via a web browser.
The server is used to communicate between the phone and the microcontroller to trigger a test. This is accomplished by connecting the server to USB using the JavaScript package “Serialport” [20]. The server receives signals from the iPhone™ to start the test and sends them to the microcontroller. The baudrate and package size are defined in accordance with the corresponding values defined in the Maple’s firmware. The server then receives the result of the measurements run by the microcontroller and gives feedback to the iPhone™ and hence to the user. This approach overcomes difficulties associated with connecting the Maple board directly to the iPhone™ [18]. Data can be sent to an iPhone™ through its audioports. However, this can only transfer one signal per line, which makes processing and noise filtering difficult. Weak force measurement signals might be severely distorted. Communication with the iPhone™ directly by serial port or Bluetooth would require Jailbreaking the phone and would not be possible with every iOS™ version.
Force data measured during the test is linearly fit to strain directly on the microcontroller. Performing the linear fit on the microcontroller improves the quality of the measurement because no datapoints are lost during conversion and transmission over the serial connection. Once the server receives the results of the fit, it divides the slope by the measured diameter of the sample to obtain a Young’s modulus in appropriate physical units (MPa).
To obtain the diameter, once a test has been run, the images are transferred from the phone to the server for processing. The image processing is performed using the MATLAB optimization toolbox. Filename data from the server must be sent to MATLAB to initialize processing. This is accomplished using MATLAB’s tcpip connection which is part of MATLAB’s instrumentation toolbox. When the MATLAB file is run, it fetches the file name from the server and then runs the image processing code on this image. Since 2 images are uploaded (before and after the tension test), the MATLAB file has to be run twice. It takes 22 seconds to run the MATLAB file on the medium-performance server computer, a significant part of which is fetching the filename from the server and automatically cropping and rotating the image. Hence, already in this first prototype, the JavaScript server timely communicates back and forth with both the iPhone™ and MATLAB and the microcontroller.
The server also includes a user interface that can be accessed from a mobile app on the phone. An audio voiceover track guides the user through the operation of the device. The app is developed using “Appcelerator Titanium”, which includes a compiler that can convert JavaScript, extended by the proprietary Titanium API, to the iPhone’s™ native language, Objective C. The iPhone™ application is programmed to open the HTTP webserver created by node.js, which is forwarded to a publicly accessible static domain using the Python-based DNS routing service “pagekite.py” [21]. The application will run in the background and play sounds even after it is closed [22]. So, the user can start the process and then minimize the application and open the camera. Guided by voice, the user receives information about the timing of the process and is asked to take pictures before and after strain has been induced into the sample. This approach allows the iPhone™ focus setting to be consistent for both images, significantly increasing the precision of the measurement. Photos are instantly uploaded into a folder on the file storage service (Dropbox), making use of their instant image upload feature [23]. So the image is already accessible by the server and by MATLAB, further reducing the time required for the device’s execution. In order to time the audio signals in dependence on the input from the Maple microcontroller, all audio.play() commands have to be called from inside the same function in the JavaScript scripts of the node.js website. This accounts for the fact that the iPhone™’s browser, Safari mobile, does not execute audio object related commands that have not been triggered by user input, such as clicking a button [24]. To overcome this requirement, a cascade of setTimeout() waiting functions gives the user a predefined time to open the camera application, set the focus and take the first picture. After the fiber straining process has finished, a setInterval() function reads the value of a variable at regular intervals of 1 second [25], which is modified when the server receives the corresponding signal from the microcontroller. This triggers the audio file to play and ask the user to take a second picture and return to the application. Also, all audio files to are merged into one to overcome the need for additional user input to play multiple sounds in Safari mobile. The file is paused and resumed using the “audio sprites” technique [26].
The user interface includes a set of instructions, a button to start the process, and a dynamically prefilled textfield and button to specify the image filenames. The user completes the filename suggested by the system using JavaScript’s time()-object. For future versions, we consider to extend the app to record the filenames within the scope of interaction with remote webservers from a security perspective.
For the sake of space… Results and Discussion can be read in the full report here: Report_HairTeam_final